The Activity - Details page displays aggregated detailed information about instance activity such as threads, reads, and wait types and times.
- In the left-hand Navigation menu, locate the Database section
- Select Activity
- On the top navigation bar, select Details
The goal of the Activity - Details page for database is to provide aggregated detailed information about the activity on databases in an environment.
Users can determine aggregated details of instances, results count, unique statement totals, parallel thread totals, blocking, logical read totals, CPU totals, and wait type and time totals.
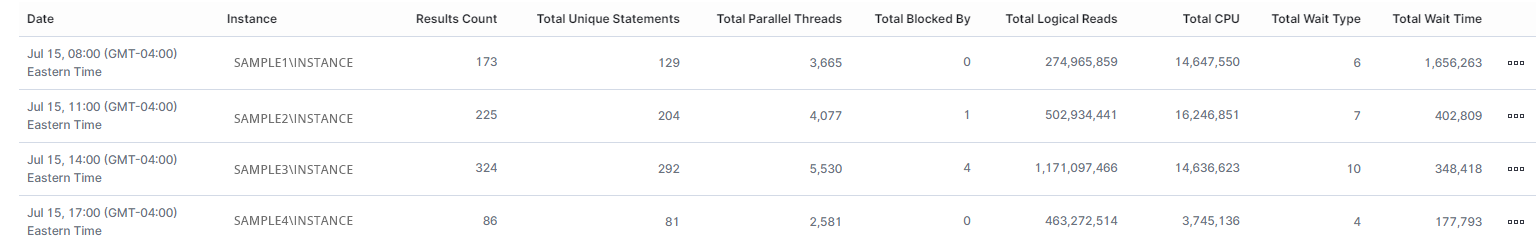
Activity is grouped by time intervals and the data found on this page is aggregated from the data in the time interval. The time intervals can be changed by adjusting the interval on the filter.