Users can determine average transactions per second and percentage of processor time, top instances, top databases, top statements, and top events of stored procedures on the Procedure Statistics - Overview Page.
- In the left-hand Navigation menu, locate the Database section
- Select Procedure Statistics
- Page will default onto Overview
The goal of the Overview page for procedure statistics is to provide insight into stored procedure statistics across your environments from a high-level view
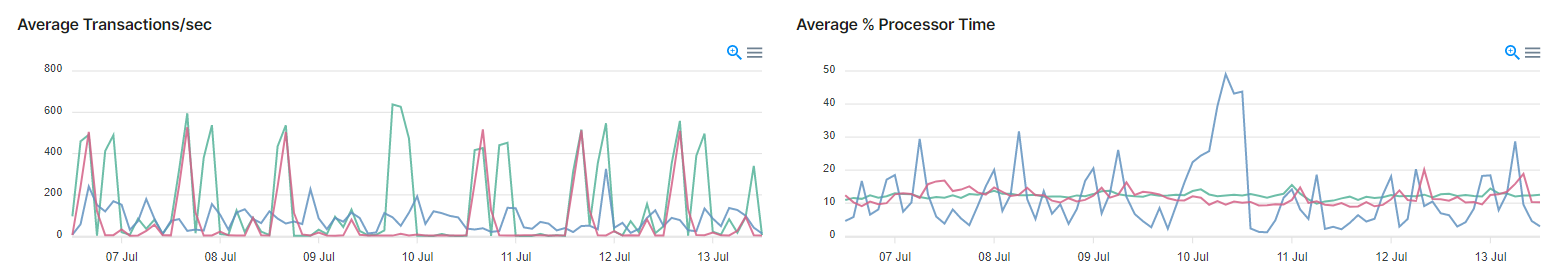
The graphs at the top of the Procedure Statistics - Overview page display the average transactions per second and the average percentage of processor time for stored procedures.
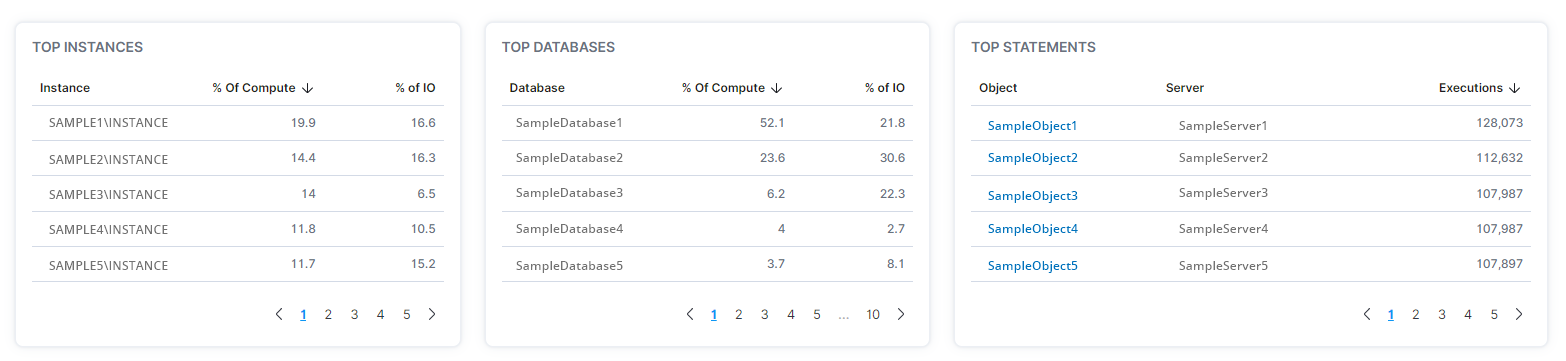
The middle of the Procedure Statistics - Overview page displays the top instances, top databases, and top statements of stored procedures.
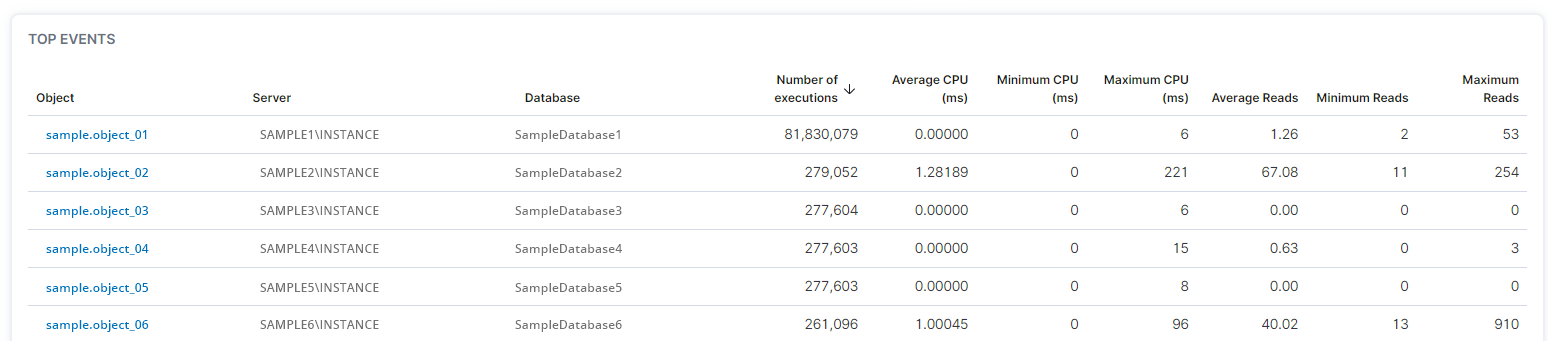
The bottom of the Procedure Statistics - Overview page displays top events of stored procedures.